Housing in Roncesvalles, Toronto
Two thirds of Roncesvalles was built before 1961 and very little has been built since, which is why it looks the way it does and why one number on this page is worth pausing on: it has one of the higher shares of dwellings reported as needing major repairs among the neighbourhoods here. In stock this age that is usually roofs, wiring and the back of the house rather than anything structural, but it is the neighbourhood to budget an inspection for.
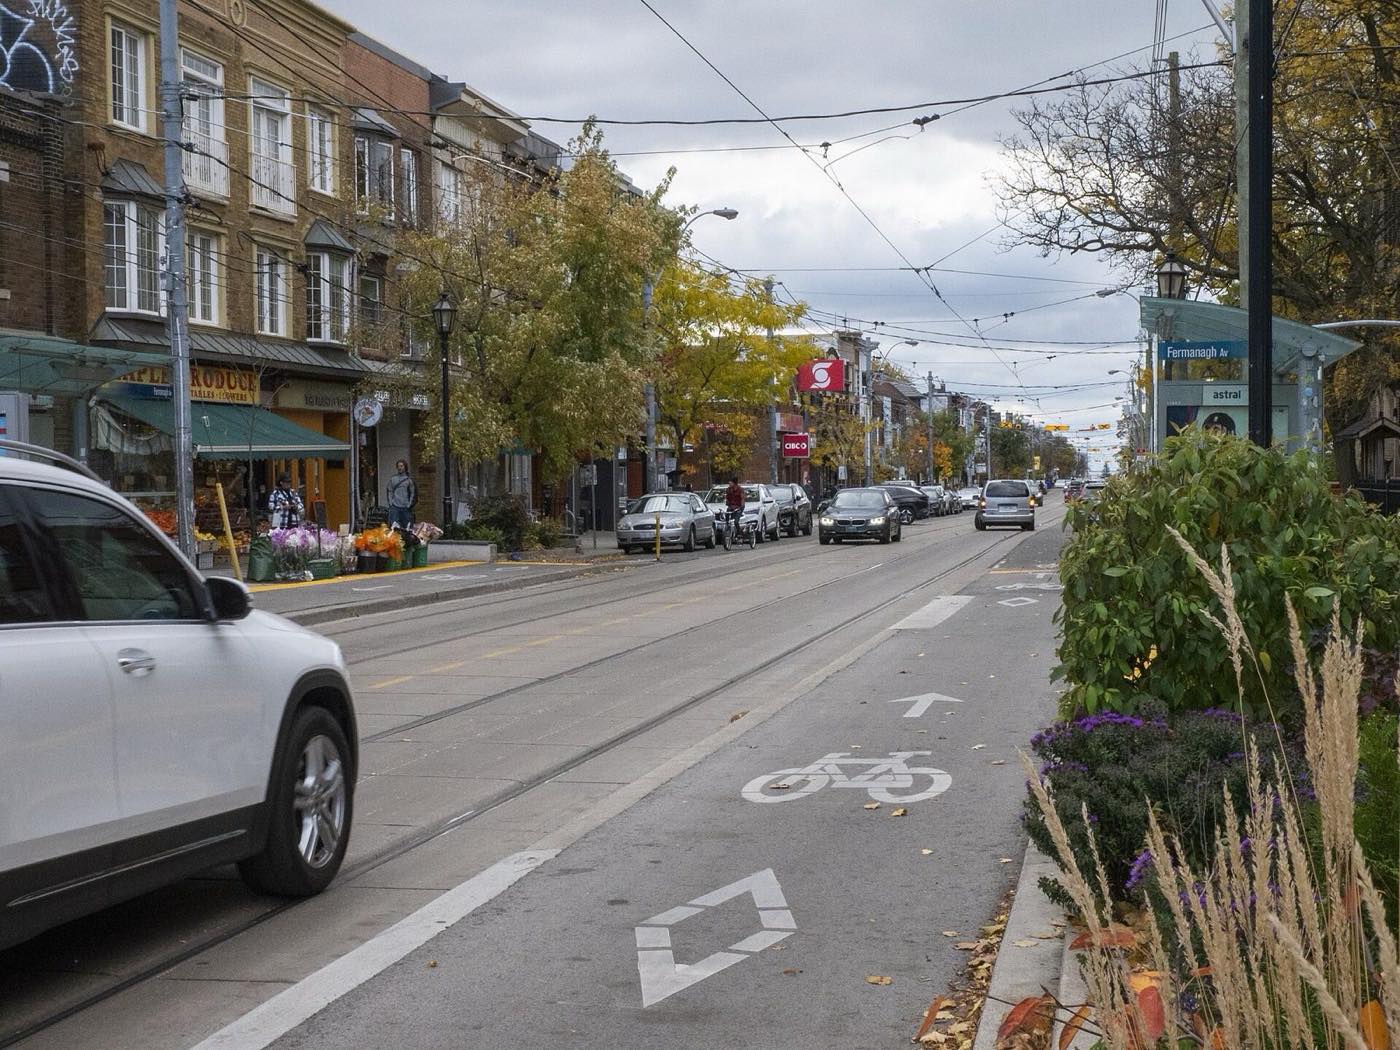
- Roncesvalles AvenueDillan Payne, CC BY-SA 2.0
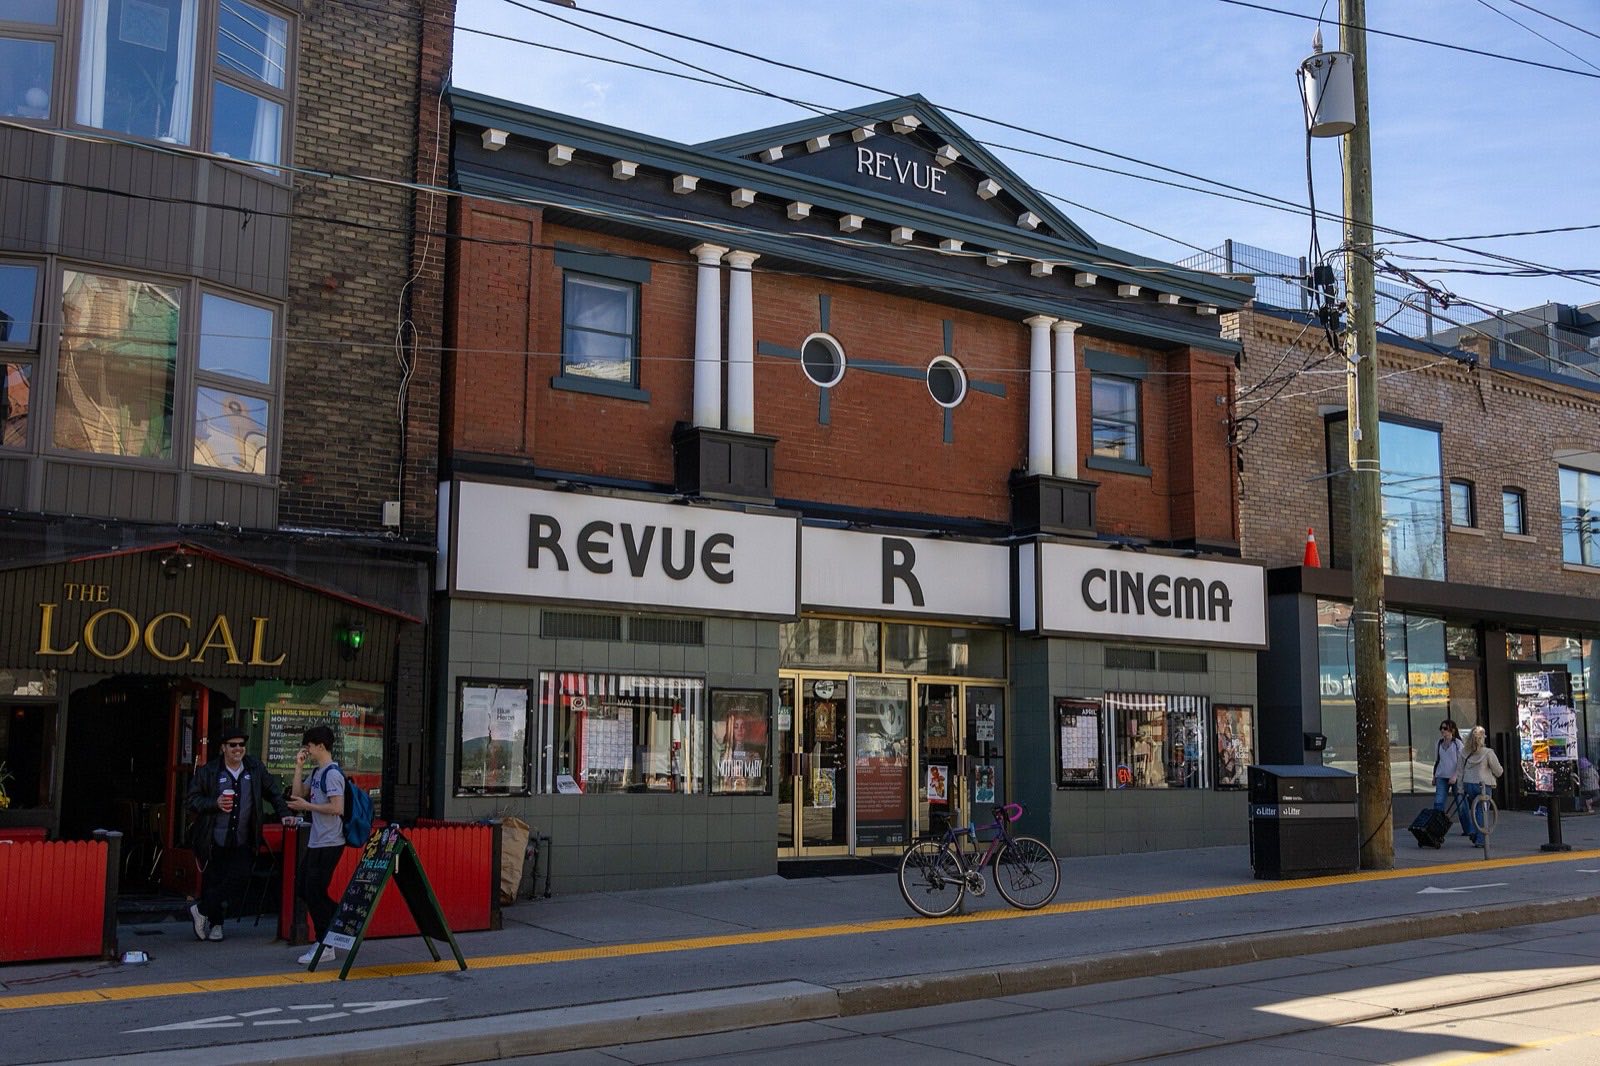
- The Revue Cinema, on Roncesvalles AvenueDillan Payne, CC BY-SA 4.0
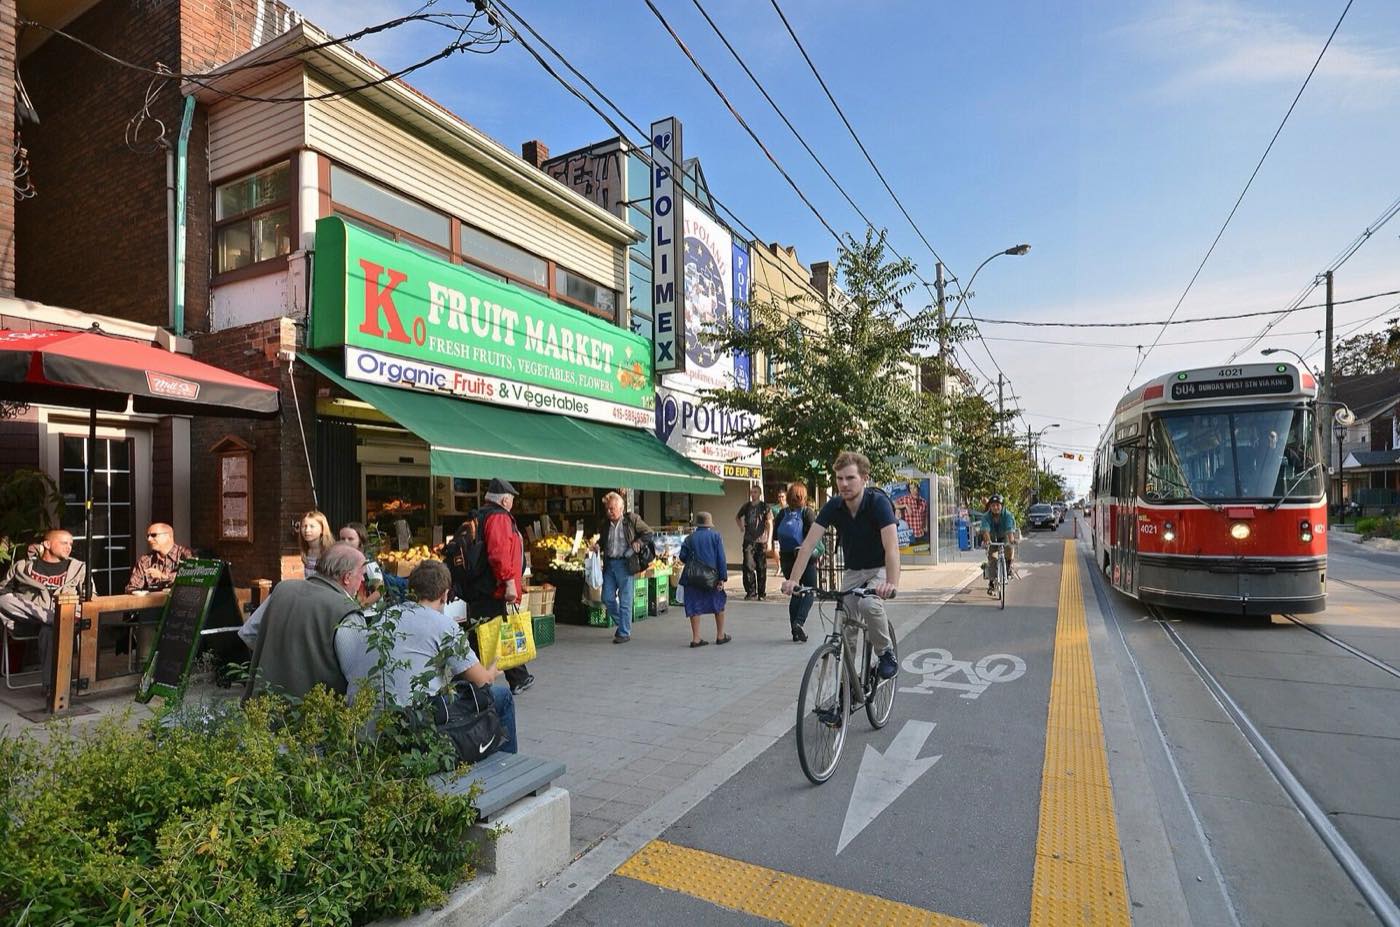
- Roncesvalles VillageMunicipal Affairs and Housing, CC BY 2.0
Photographs from Wikimedia Commons, used under the licence shown with each one. A photograph is here because it was taken inside this neighbourhood's boundary or because its own page names this neighbourhood or its main street, and because somebody looked at it.
- People
- 14,610
- Households
- 6,785
- Median dwelling value
- $1.3M
- Median household income
- $88K
What stands out about Roncesvalles
- 67% of its housing was built before 1961, higher than the middle of Toronto's 158 neighbourhoods at 29%.
- 10% of its dwellings are reported as needing major repairs, higher than the middle of Toronto's 158 neighbourhoods at 7%.
- The median dwelling value is $1,300,000, higher than the middle of Toronto's 158 neighbourhoods at $900,000.
- 10% of its dwellings are detached houses, lower than the middle of Toronto's 158 neighbourhoods at 26%.
What is built here
- Detached house
- Semi-detached house
- Row house
- Duplex
- Apartment, under five storeys
- Apartment, five storeys or more
And how many bedrooms it has
- One bedroom
- Two bedrooms
- Three bedrooms
- Four or more bedrooms
When it was built
The most useful line on this page. Almost everything a home inspection turns up in Toronto is a function of the decade the house went up in, and so is most of what an insurer asks about.
- 1960 or before
- 1961 to 1980
- 1981 to 2000
- 2001 to 2010
- 2011 to 2021
What to check before you buy in Roncesvalles
Raised by the housing stock above, not by any particular house. Each one is a question to ask rather than a problem to expect.
- Wiring, and what the insurer will say about itA large share of the housing here was built before 1961, which is the stock where knob and tube wiring turns up. Some insurers will not bind a policy on it, and finding that out after the offer is firm is expensive. Ask what the panel is, whether the house has been rewired, and get the answer before the financing condition comes off.
- The supply line into the houseHouses of this age often still have the original galvanized supply line, which narrows with age and shows up as poor pressure upstairs. Replacing it is a road cut and a permit, not an afternoon. Run a tap on the top floor while something else is running downstairs.
- Budget for the inspection, and for what it findsHouseholds here report a higher than usual share of dwellings needing major repairs. In stock of this age that is typically roofs, windows and the back of the house rather than anything structural, but it is the neighbourhood to keep a contingency for rather than to spend on the offer.
- Whether the place you are buying has a tenant in itMost households here rent, so a good share of what comes up for sale is tenanted. A tenancy continues after a sale in Ontario, and the rules about a purchaser moving in are specific and worth reading before you write the offer rather than after.
What it costs to live here
- Owner monthly shelter cost
- $2,000
- Renter monthly shelter cost
- $1,400
- Owners with a mortgage
- 61%
- Households renting
- 53%
Shelter cost is the census measure: for an owner it is the mortgage payment, property taxes, condominium fees and utilities together, and for a renter it is rent and utilities. These are medians from 2021, so read them as the shape of the place rather than as a quote.
How people get to work
- Car, truck or van
- Public transit
- Walked
- Bicycle
Where these numbers come from
2021 Census of Population, Statistics Canada, tabulated by the City of Toronto Open Data as Neighbourhood Profiles, with neighbourhood names and boundaries from Neighbourhoods. Retrieved September 18, 2026. The City publishes both packages with their licence recorded as "License not specified".
These are aggregate figures for a whole neighbourhood from a census taken in 2021, so they lag the market and they describe no individual home. Housey is not a real estate board and this is not MLS data: for what a specific house is worth today, ask a realtor.