Housing in Bedford Park-Nortown, Toronto
Bedford Park-Nortown reports the highest dwelling values on this list, and the reason is visible from the sidewalk: a third of the housing stock predates 1961, a quarter of it went up between 1981 and 2000, and a fifth of it has been built since, on the same street grid. More than half of everything here is detached. A neighbourhood mid-rebuild is a neighbourhood where the house next door is not a comparable.
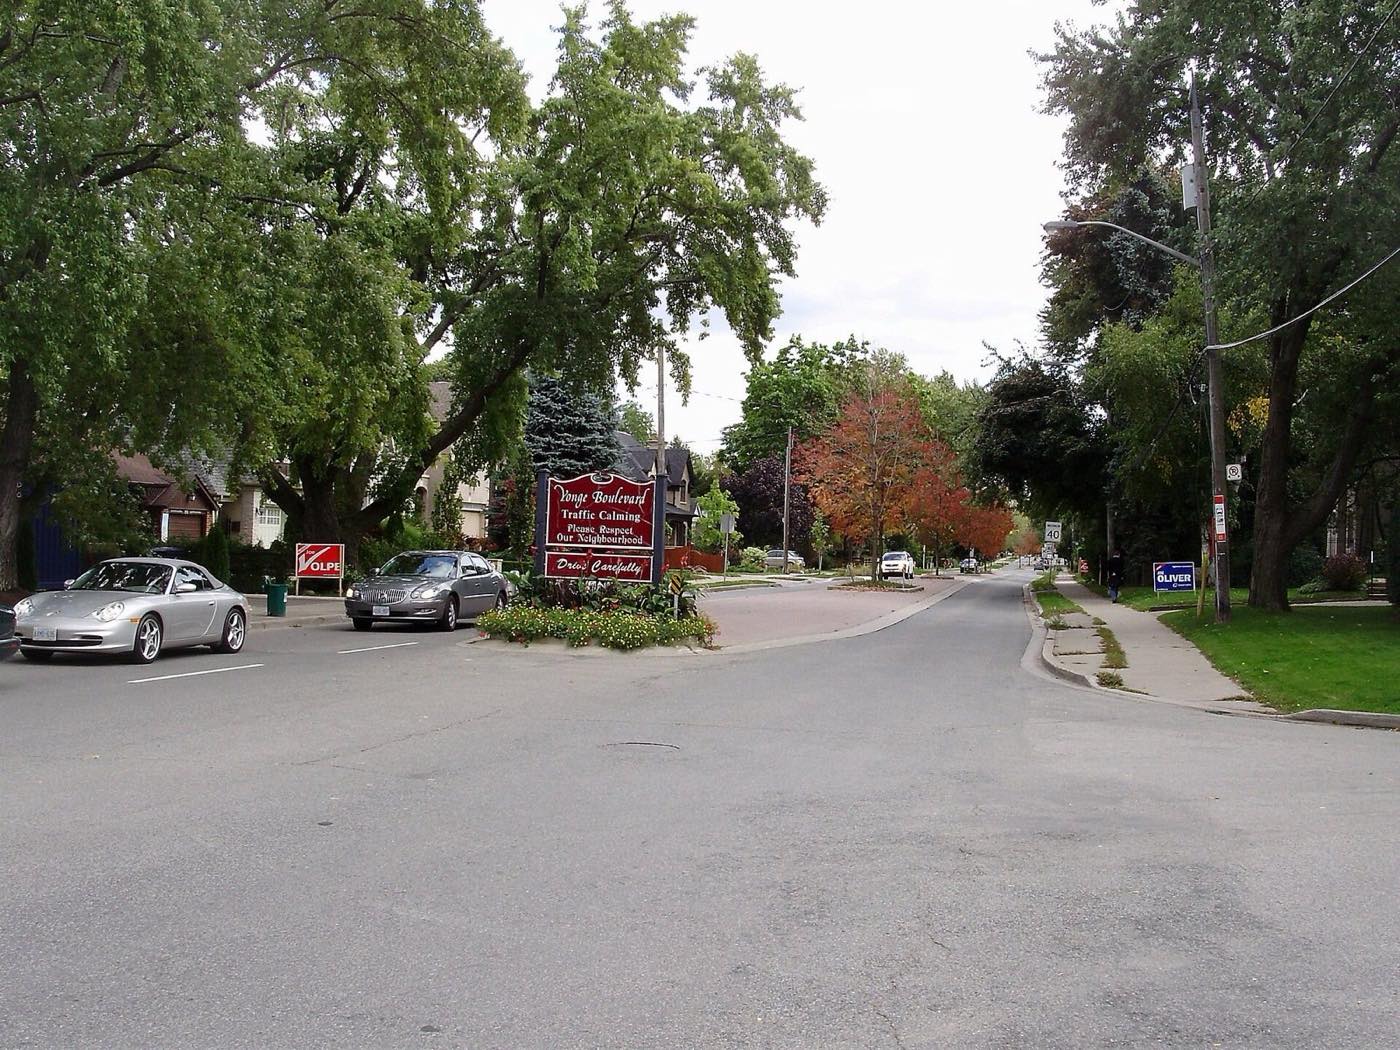
- Yonge BoulevardGTD Aquitaine, Public domain
Photographs from Wikimedia Commons, used under the licence shown with each one. A photograph is here because it was taken inside this neighbourhood's boundary or because its own page names this neighbourhood or its main street, and because somebody looked at it.
- People
- 22,145
- Households
- 8,335
- Median dwelling value
- $2.3M
- Median household income
- $135K
What stands out about Bedford Park-Nortown
- The median dwelling value is $2,260,000, higher than the middle of Toronto's 158 neighbourhoods at $900,000.
- 57% of its dwellings are detached houses, higher than the middle of Toronto's 158 neighbourhoods at 26%.
- 44% of its dwellings have four or more bedrooms, higher than the middle of Toronto's 158 neighbourhoods at 18%.
- The median household income is $135,000, higher than the middle of Toronto's 158 neighbourhoods at $84,500.
What is built here
- Detached house
- Semi-detached house
- Row house
- Duplex
- Apartment, under five storeys
- Apartment, five storeys or more
And how many bedrooms it has
- One bedroom
- Two bedrooms
- Three bedrooms
- Four or more bedrooms
When it was built
The most useful line on this page. Almost everything a home inspection turns up in Toronto is a function of the decade the house went up in, and so is most of what an insurer asks about.
- 1960 or before
- 1961 to 1980
- 1981 to 2000
- 2001 to 2010
- 2011 to 2021
What to check before you buy in Bedford Park-Nortown
Raised by the housing stock above, not by any particular house. Each one is a question to ask rather than a problem to expect.
- Kitec fittings, if it was plumbed in the late 1990s or 2000sA fifth or more of the housing here dates from the years when Kitec plumbing was installed. The fittings are usually brass in orange or blue pipe, most visible under a sink or at the water heater. It was the subject of a class action settlement and it is something a condominium corporation will know about its own building.
- What was added, and whether it was permittedIn a neighbourhood this detached, a large share of the houses have been added to or finished below grade at some point. The City's building records will say what was permitted. An unpermitted addition is not automatically a problem to walk away from, but it is a problem to know about rather than inherit.
What it costs to live here
- Owner monthly shelter cost
- $1,940
- Renter monthly shelter cost
- $1,480
- Owners with a mortgage
- 40%
- Households renting
- 32%
Shelter cost is the census measure: for an owner it is the mortgage payment, property taxes, condominium fees and utilities together, and for a renter it is rent and utilities. These are medians from 2021, so read them as the shape of the place rather than as a quote.
How people get to work
- Car, truck or van
- Public transit
- Walked
- Bicycle
Where these numbers come from
2021 Census of Population, Statistics Canada, tabulated by the City of Toronto Open Data as Neighbourhood Profiles, with neighbourhood names and boundaries from Neighbourhoods. Retrieved September 18, 2026. The City publishes both packages with their licence recorded as "License not specified".
These are aggregate figures for a whole neighbourhood from a census taken in 2021, so they lag the market and they describe no individual home. Housey is not a real estate board and this is not MLS data: for what a specific house is worth today, ask a realtor.